What is the NDI Analysis Tool and where do I get it from?
NDI Analysis Tool is a command-line driving application designed for Windows to measure the frame size and timing of received frames, which can then be used to give a somewhat accurate idea of where a potential problem can be.
To download it: you can get it from here.
Please keep in mind that this application is in Beta, but can still be used to give an idea of NDI quality performance- it's not intended to be a network diagnosis tool.
To use NDI Analysis Tool, either double-click it or run it from command line.

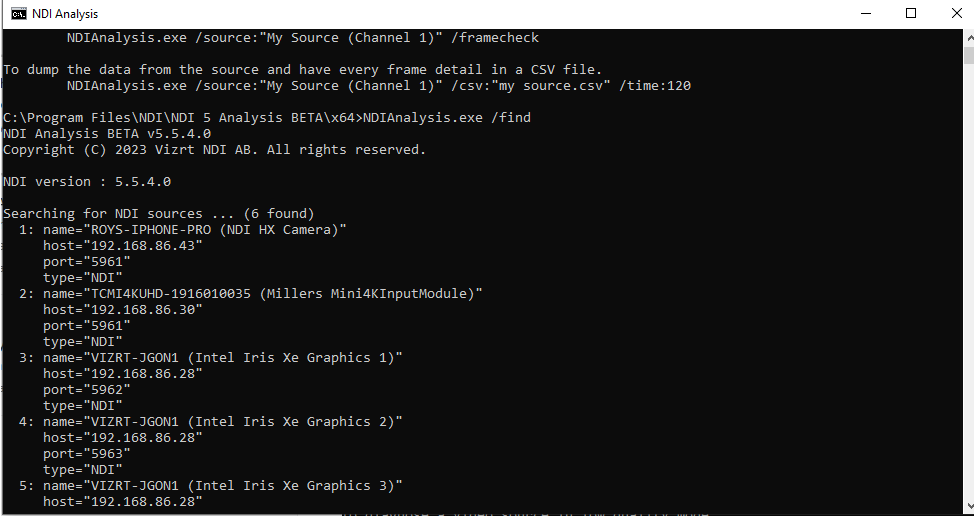
Unless you know the name of your source, run
NDIAnalysis.exe /find
to find a list of all NDI sources on your network.
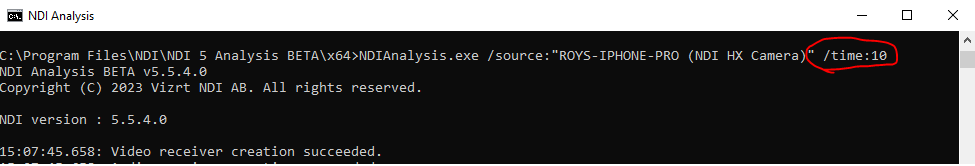
Once your source is identified, run
NDIAnalysis.exe /source:"SOURCE NAME"
to let it run indefinitely (CTLR-C will force stop the analysis) or append the end with
/time:###
where ### is the amount of seconds you want it to run. In my example, I wanted a ten second run:
Let it run for it's allotted time (or hit CTLR-C to stop running it) and look at the data presented:
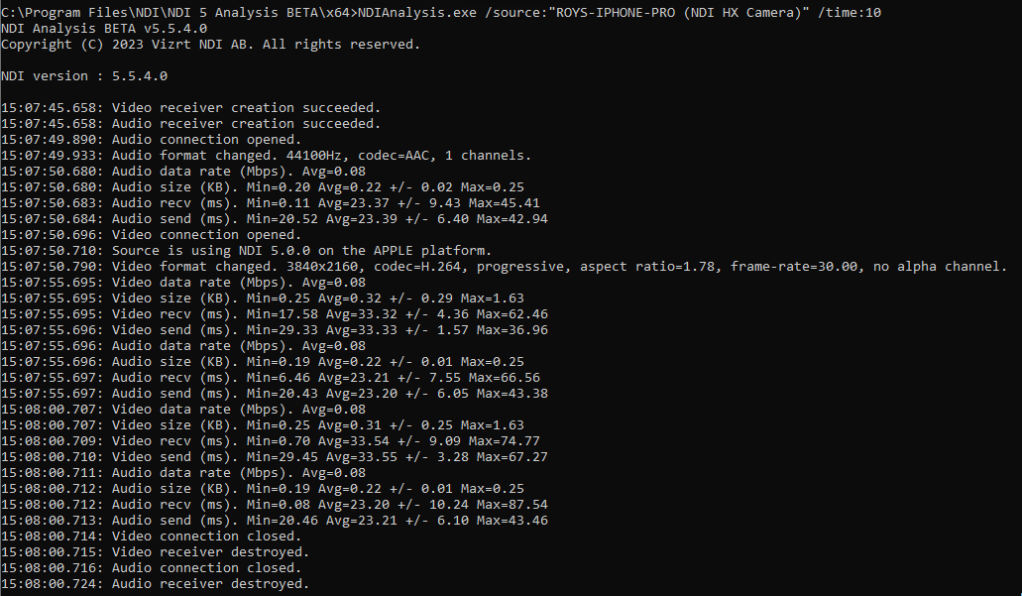
From here, there are a few things to note:
15:07:45.658: Video receiver creation succeeded.
15:07:45.658: Audio receiver creation succeeded.
This message is the local system that that the NDI Analysis Tool opened the receiver. If the program stops there and no other data is displayed, then your source is either not sending audio and video (thus NDI Analysis is constantly "waiting for source" mode), you've either got a typo in the source name, or the source is offline or you have a firewall or other security application preventing it from receiving any audio/video (for example, it can connect to the port identifying on the network, but cannot receive audio or video).
15:07:49.890: Audio connection opened.
15:07:49.933: Audio format changed. 44100Hz, codec=AAC, 1 channels.
15:07:50.696: Video connection opened.
These lines mean that audio and video were successfully received and will now be measured. It's important to note here that this is receiving the NDI signal and is simply not displaying it. If you were to run NDI Analysis and Studio Monitor side-by-side, your essentially receiving the signal twice.
15:07:49.933: Audio format changed. 44100Hz, codec=AAC, 1 channels.
15:07:50.710: Source is using NDI 5.0.0 on the APPLE platform.
15:07:50.790: Video format changed. 3840x2160, codec=H.264, progressive, aspect ratio=1.78, frame-rate=30.00, no alpha channel.
These lines indicate that the source is an APPLE device as advertised within the NDI stream- this is a developer implemented option. It also shows that what version of NDI the sending device is using (in this case, NDI 5.0.0). The lines about Audio Format and Video Format change indicate that the signal is now being sent at that bitrate/resolution/frequency. In my example, the NDI HX camera app is sending audio encoded in AAC, mono, a 44.1khz . The video is sent at UHD resolution, encoded in H264, at 30fps progressive in an 1.78 aspect ratio, and with no alpha support built into that stream. Because the encoding is set to H264, it can be safely assumed that this is an NDI HX signal (the same is true if it were sent in H265). If it were sent in SHQ, then it can be assumed the signal is sent in full bandwidth NDI. If either the audio or video signal changes midstream, then the same "audio/video format changed" message would come up, with the new values.
15:07:55.695: Video data rate (Mbps). Avg=0.08
15:07:55.696: Audio data rate (Mbps). Avg=0.08
These lines will indicate the data rate at that particular moment- these numbers can change if the application is sending i-, p-, or b- frames. For example, a shot of as static background that doesn't change from frame to frame doesn't need to be resent each time and instead the receiver will hold onto the previous frame of data, lowering the data rate for video. Likewise, a camera pointed at a tv displaying snow or static will have constantly changing frames and would have a much higher data rate average.
15:07:55.695: Video recv (ms). Min=17.58 Avg=33.32 +/- 4.36 Max=62.46
15:07:55.696: Video send (ms). Min=29.33 Avg=33.33 +/- 1.57 Max=36.96
and
15:08:00.712: Audio recv (ms). Min=0.08 Avg=23.20 +/- 10.24 Max=87.54
15:08:00.713: Audio send (ms). Min=20.46 Avg=23.21 +/- 6.10 Max=43.46
These numbers indicate the send/receive timing of audio and video. Generally, you want the middle value, the Avg, to be as low and steady as possible. Wild fluctuations in either the recv or send will usually indicate a poor NDI quality. The recv value measures how long it takes the receiver (NDI Analysis Tool in this case) to receive the signal when compared against when the sender sent it. If the value changes too much from sample to sample, then the receiver is congested or is taking a while to receive the data due to hardware resources or local software interrupting the flow. Likewise, the send must stay as constant as possible, and measures the timing of the sender- large fluctuations of the sender indicate either network congestion or resource congestion on the sender side such as it having to render too many NDI signals. If both numbers are relatively stable but high, then the most likely issue you're looking at is general network latency.Ideally, you'd want that number to be at or just about a certain value, which is calculated as [1000/(framerate)]. See this chart for the most common frame rates and an expected values:
| Frame rate | Expected Average time |
| 25 | 40ms |
| 29.97 | 33.36...ms |
| 30 | 33.33...ms |
| 59.94 | 16.68...ms |
| 60 | 16.66...ms |
A higher delay in the Avg time can be resolved by changing the network connection (in my example, the iPhone was sending the data over a mesh network to a receiver, also connected via wifi. Wired might have produced better results if the values were constantly higher than expected. Also, while Avg is definitely the value we want to look at, the Max value can indicate a potential problem if it's not consistent. single instances of a high Max value when compared against the rest of the analysis aren't concerning, but multiple spikes of the Max value can indicate a problem that is being mitigated by NDI's technology- If you see a consistent Avg value but occasional spikes of Max value, and you've not made any changes to the video (such as suddenly switching the signal from 720 to UHD or by going from a still background (e.g. leaving the lens cap on) to a shot of movement (e.g. suddenly taking the lens cap off), then NDI is doing it's best to accommodate high network inconsistencies with some success using, but you should still look into the sending or receiving device for a potential cause.
15:08:00.714: Video connection closed.
15:08:00.716: Audio connection closed.
These lines indicate that the sender stopped sending audio and video. This could be due to the source going offline (such as dropping off the network) or losing the ability to transmit. NDI by it's nature will keep the receiver open for a certain length of time for situations like this. If it's a planned shutdown, as in the receiver requested the end of the transmitted signal, then Analysis Tool will report:
15:51:11.672: Exit requested.
and/or
15:51:12.179: Video receiver destroyed.
15:51:12.191: Audio receiver destroyed.
In my screenshot example, "Exit Requested" is not displayed as the test was ran for a planned 10 seconds.
As a last note, Windows Command Prompt/Console has a limit as to how much data it can retain, so letting Analysis Tool run indefinitely will result in lost data points. If you intend to run Analysis Tool for longer than a few minutes or if you want to analyze or share the data after the fact, you can append the command with
> FILEPATH.txt
so that it will generate a file instead of displaying it. For example:
NDIAnalysis.exe /source:"PC1 (Intel Iris Xe Graphics 1)" /time:300 > d:/dump.txt
will run the analysis program from my PC running Scan Converter for 5 minutes and write the data to a file called 'dump.txt' on my D drive

